With QuerySurge BI Tester for Tableau, data testers can use familiar SQL syntax to retrieve query data from Tableau Worksheets or Dashboards and validate it against any QuerySurge-supported Source or Target. Tableau connections can be set up in the QuerySurge Admin view, and utilized in the same manner as any other Connection types (i.e. in QueryPairs and Staging Queries, and Test Suite Connection overrides).
For details on setting up a connection to Tableau, see the article Connecting QuerySurge to Tableau.
Tableau Asset Types
In order to test Tableau it is important to know the different asset types:
Project: A project allows for assets to be separated to enable easier administration.
Workbook: A container object which contains one or more Sheets. This is very similar to the MS Excel workbook concept.
Worksheet: Contains one View as well as labels and filters
Dashboard: A collection of one or more Views from multiple Worksheets into a single display element.
View: A data visualization.
Story: A sequence of Worksheets or Dashboards.
Base URL Structure
The URL structure for Tableau depends on whether Tableau Server is configured for a standard environment or a multi-site environment. The following examples show the difference in URL structure between a standard Tableau server install and a multi-site setup.
-
Standard
http://<servername>/#/views/<workbook>/<sheet> -
Multi-site
http://<servername>/#/site/<sitename>/views/<workbook>/<sheet>
 Note: The remaining examples used in this article are for a standard Tableau environment. For a multi-site environment, use the multi-site format in all URLs.
Determining a URL for a Report
In order to retrieve report data, URLs need to be constructed that can be used to return the data. For this, information from the Tableau web interface is needed. The process of building a URL starts by navigating to the specific Worksheet/Dashboard which contains the report for the test. In the example below, we have navigated to the Project "Tableau Samples", Workbook "Regional", and Dashboard "Economy". This workbook will be used throughout this document.
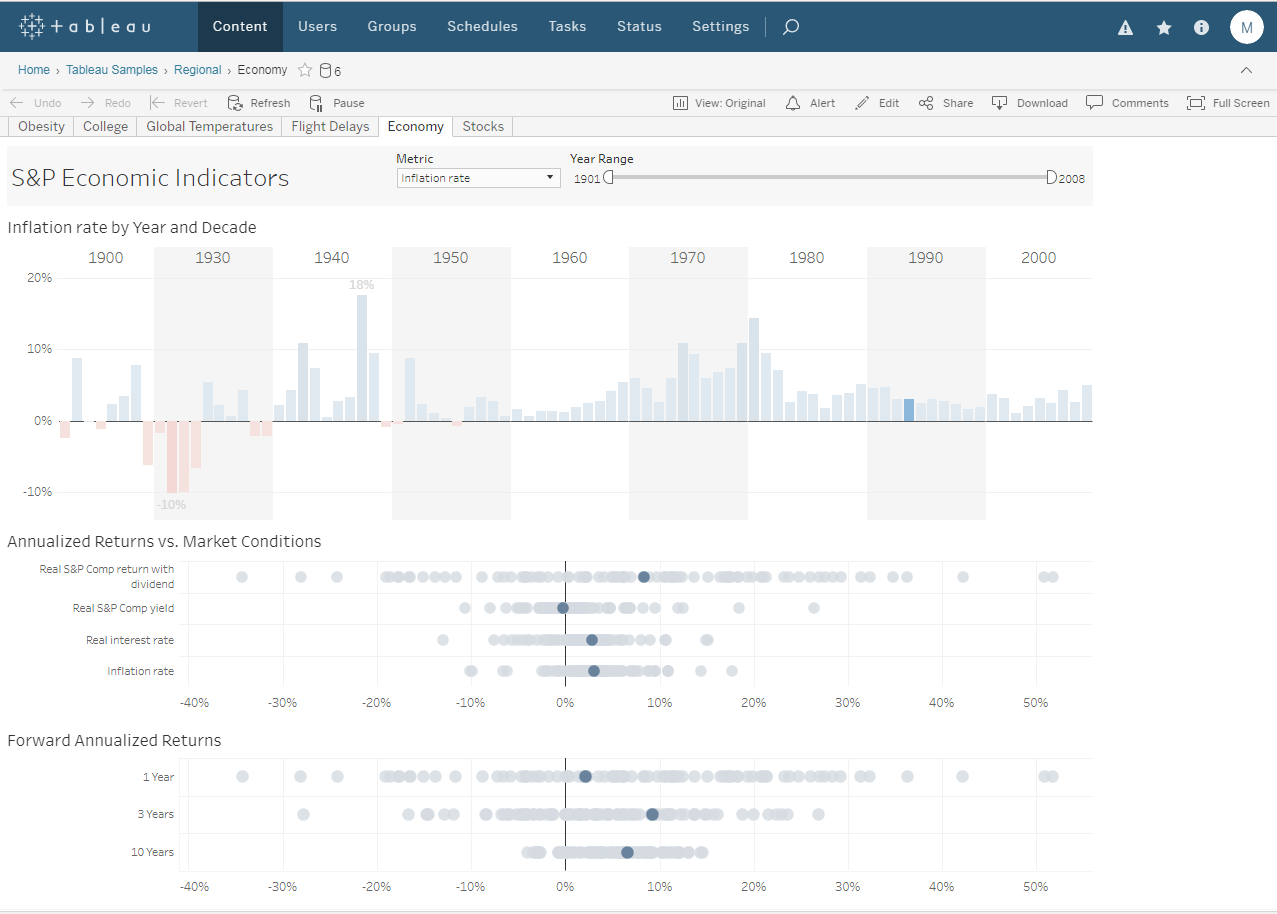
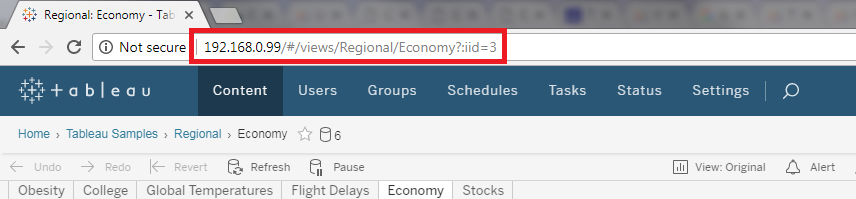
When you have navigated to the report of interest, the browser URL reflects the item displayed. This URL is used in QuerySurge to identify the Tableau report data to extract. In the following example, the URL is: http://192.168.0.99/#/views/Regional/Economy?:iid=3. The pattern for this URL is "http://<server>/#/views/<workbook>/<sheet>?:iid=N". For the QuerySurge URL, the portion of the browser URL to use is "/views/Regional/Economy". The hostname/IP portion of the URL, and the part following the "?" should be omitted.
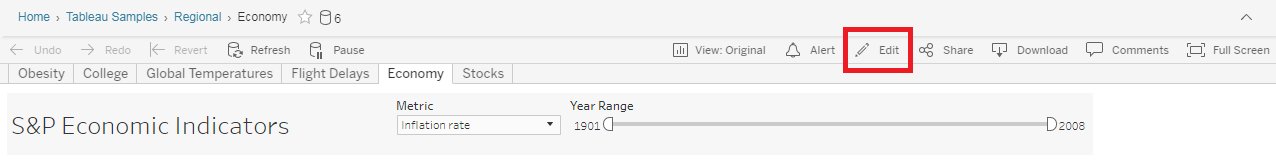
Next, we will need to extract the name of the Worksheet. QuerySurge BI Tester treats each Worksheet as a table. Dashboards in Tableau can contain multiple Worksheets, so we will need to determine the name of the Worksheet whose data we want to extract. To find the name of the Worksheet, click the "Edit" button located on the asset's toolbar:
Depending upon the asset type, different approaches are needed to determine the Worksheet's name. It's important to note that when extracting data from Dashboards, Worksheets that are not visible may be present. QuerySurge can only access visible Worksheets, which are identified in Tableau by a blue check mark icon.

Dashboard Worksheet identification
On the left side above, a list of all available worksheets is displayed. As dashboards can display multiple Worksheets, it is useful to select each Worksheet to determine which visualization (i.e., view) it controls. In the dashboard below, the Worksheet "S&P Returns Vs. Conditions" controls the middle visualization.

To extract the worksheet's name, right click the worksheet and select Rename Sheet. In this example the worksheet name is "S&P Returns Vs Conditions".

Worksheet Identification
In addition to Dashboards, it is possible to display a single Worksheet. In the example below, the layout no longer contains a list of Worksheets. To determine the name for this Worksheet, use the bottom tab bar as highlighted below. The active Worksheet is highlighted.

To extract the worksheet's name from a tab, right click the tab entry and select Rename Sheet. In this example the worksheet name is "Performance".

Querying Report Data
The query syntax for BI Tester queries is based on H2 SQL and supports most of the H2 SQL grammar and its function calls, so SELECT-type queries against Tableau follow a familiar form. The main element is the tableauReport table function, which instructs the BI Tester driver to execute the report and pull back the query data as a table for you to query. The function's syntax is as follows:
tableauReport('<URL>','<Worksheet>')
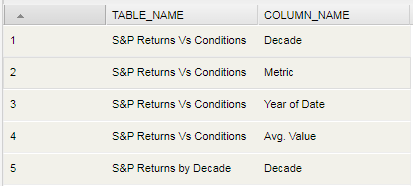
The function's arguments must be surrounded by single quotes. Following is a sample SQL statement against the S&P Returns by Decade worksheet located in the Economy Dashboard
SELECT *
FROM tableauReport('/views/Regional/Economy','S&P Returns by Decade')
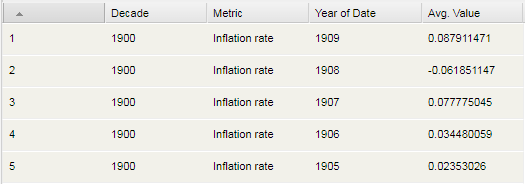
When executed in QuerySurge, the following results are returned:
Queries can include standard syntax like joins, group by, single-valued functions, aggregate functions, aliases, and more. Note that references to column names with spaces or special characters must be surrounded by double quotes:
SELECT rbd."Decade",

rbd."Metric"
FROM tableauReport('/views/Regional/Economy','S&P Returns by Decade') AS rbd
Querying Report Metadata
When developing data tests for Tableau reports, it can be useful to see information about the datasets returned by the report for learning about the columns available. Metadata can also be used to compare a report between two Tableau servers. To obtain metadata for a report, use the tableauMetadata function as follows:
SELECT *
FROM tableauMetadata('/views/Regional/Economy')
Note that tableauMetadata can only retrieve one report per metadata query, and it cannot be combined with a report data query (i.e.joins are not supported). This query returns the query names (as table names) and column names for all queries in the report (the example here is truncated for brevity):
Passing Parameters to report
In many cases filters/options are available on a Tableau report. These parameters are passed on the URL and can be used in QuerySurge. For more information on Tableau URL parameters and how they are formed, see the Tableau documentation.
Once you have identified parameters that are useful, they can be passed to the tableauReport table function. In the following example, the parameter value "3 Years" is passed for the parameter "Metric" on the URL.
SELECT *
FROM tableauReport('/views/Regional/Economy?Metric=3%20Years','S&P Returns by Decade')
Note: View URLs must be URL encoded as shown. The '%20' indicates a space character. If you need the encoded value of a character to include on a URL, there are numerous "URL encoder" pages available on the web.
Known Issues
- In Tableau 10.5 some reports return faulty headers with the data. When this is detected QuerySurge's BI Tester driver automatically assigns header values of the type "COL_1", "COL_2", etc. In this case, you will need to use these column names in your query, not the names on the actual report. As shown in the following example, you can alias these auto-generated column names to more meaningful names:
SELECT COL_1 AS DECADE, COL_2 AS METRIC, COL_3 AS "YEAR OF DATE"
FROM tableauReport('/views/Regional/Economy?Metric=3%20Years','S&P Returns by Decade')