Versions:6.2+
QuerySurge Performance Report
Test execution performance in QuerySurge is dependent on many factors, such as source system performance, test data characteristics, and QuerySurge server hardware performance. While the recommended QuerySurge system requirements are a good starting point for trial, proof-of-concept, and production deployments, hardware and configuration modifications can yield significant improvement to test execution performance and user experience.
To aid in an iterative performance tuning process, the Performance Report provides a snapshot of system metrics for each component in your QuerySurge instance. This report helps to identify bottlenecks in CPU, RAM, and disk usage during test execution, and can be utilized to determine hardware or configuration tweaks for better performance.
Performance Metrics
The Performance Report features the following metrics in both graphical and tabular format:
- Database disk (percentage):
- Data directory
- Temp directory
- Database memory (bytes)
- Database CPU (percentage)
- App server memory (bytes)
- App server CPU (percentage)
- Agent disk (percentage)
- Agent memory (bytes)
- Agent CPU (percentage)
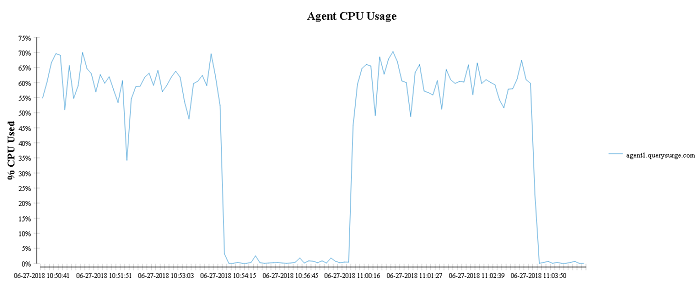
CPU Utilization
Shows CPU usage for the core processes in the QuerySurge instance over time, measured in percent CPU time. If any QuerySurge machines have multi-core or multi-threaded CPUs, the CPU usage metric will be the sum across all CPU cores (which may add up to over 100%).
Memory Usage
Shows memory (RAM) usage for the core processes in the QuerySurge instance over time, measured in bytes.

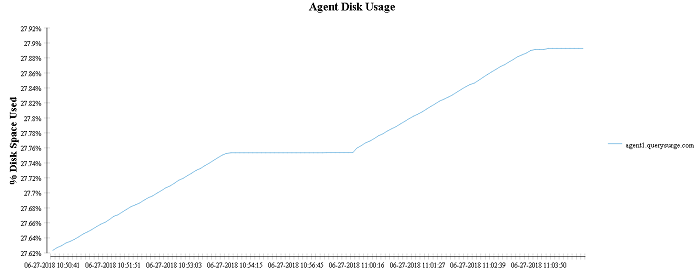
Disk Usage
Shows disk usage for the database (temp and data directories) and all agents (temp directory) in the QuerySurge instance over time, measured in percent.
Report Options
Display options for the Performance Report are similar to those in other QuerySurge reports:
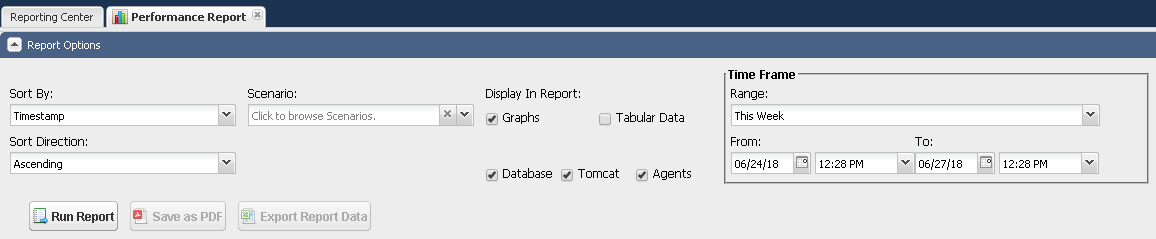
- Sort By - sort field of the data points in each graph/table
- Sort Direction - sort order of the data points in each graph/table
- Scenario - scenario to limit the time frame of reported metrics
- Display In Report - components to include data for, and whether to show the graphical and/or tabular views for those components
- Time Frame - limit the time frame of reported metrics (if not using a selected scenario)
Collection of Performance Metrics
System performance metrics are collected by the QuerySurge Statsmon service, which is installed on all machines where QuerySurge components are running. This service must remain running in order to collect metrics.
Data is collected by Statsmon at user-configurable interval, defined in QuerySurge Administration:
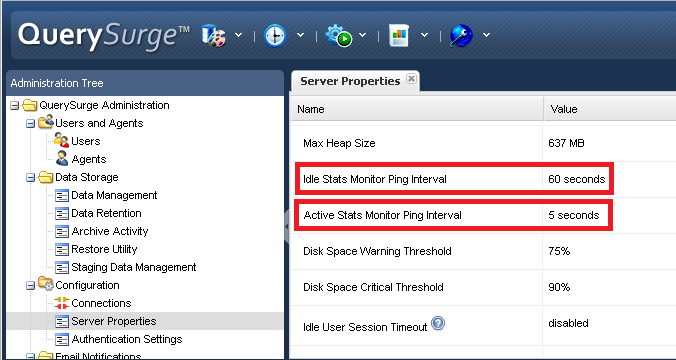
The Idle ping interval determines how frequently Statsmon sends metrics when QuerySurge is not currently running a test (Scenario or Design-Time Run), and the Active interval determines the frequency during active test execution.
 Note: Transition from the Idle interval to the Active interval may be delayed based on the Idle interval setting. Reduce the Idle interval to allow quicker response to the start of test execution.
Note: QuerySurge stores up to 10,000 data points; after that, older data points will be purged, which may impact historical reports.